
Hello Readers,
We are back with another learning blog for our readers interested in the stock market and trading. In this blog, we will discuss a website that can be a great help when it comes to watching stocks and assets live during market hours.
TradingView, is a charting/screener website that helps you to track your interested stock market assets. When it comes to deciding to buy and sell in the stock market, people often make use of charts. These help them to improve their decision-making in the stock market.
This website can be used for multiple purposes. Be it a close look at the latest stock price or a post-market analysis. The trading view has got you covered. The basic version of charting in tradingview has the option of adding up to 3 indicators. Indicators in the stock market are based upon the price action followed by the assets. If you want to know more about it, do let us know in the comments.
The website offers 3 indicators in the basic version and allows you to view the price movement as low as per minute timeframe. You can choose your preferred timeframe from a wide range of varieties.
And all of these comes to you at no cost! Absolutely Free!
The 5 Easy Steps!
Here are the simple steps to set-up your trading view screen and get ready for trading. By the way if you haven’t yet opened your demat account, then here is your chance to get a free brokerage of worth Rs. 2000/- from Angel Broking(Limited Time Offer) Click here to open an account now for free!
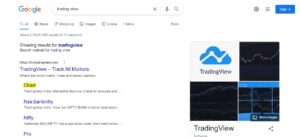
Step 1: Google Search ” Trading View”
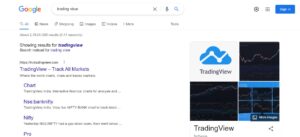
Step 2: Once you have your search results ready click on the Chart option;
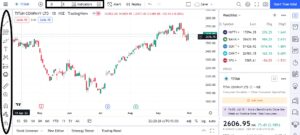
Step 3: Once you click the Chart option from the result set you will have something like below on your screen.
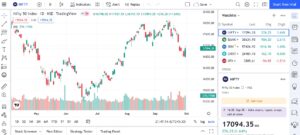
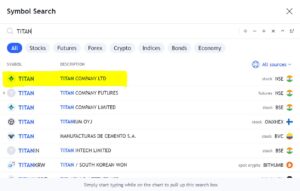
Step 4: If you want to change the chart by adding the stock or asset of your interest then click on the top left corner and a search panel would appear. (Highlighted in Yellow)
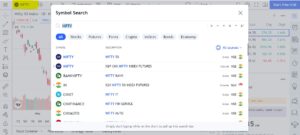
In the search box you can type the stock/asset name and hit enter, let’s say you want to search a stock “TITAN” which is listed on NSE, Indian Exchange. Then clicking on it would land you to the chart of the stock where you can look at the live market movements and also the previous day/month/years tracking becomes so easy. (Highlighted in Yellow)
Step 5: The default timeframe mode for any chart would be Day(D); you can click on it to make changes per your trading style. The lower timeframe includes 1-3-5-15 mins, whereas one can also go for monthly timeframes for trend analysis. The top panel has options to change the pattern of your chart, which is candlesticks by default. Also, the indicator section helps you to add as many as 3 indicators in the free version.
There are multiple options in the free version of this fantastic website which I have marked already for you. Explore each of them, and let us know if you need any help using them.
Conclusion:
For a typical retail trader/investor, a free version is good enough at the initial stage. But as you become an expert in this niche, consider upgrading to their premium version, which offers even more services to you and assures that you have the edge over others in the stock market.
In the coming blogs, we will cover price action and chart reading. Stay Tuned!