
Stock Market Trading is a highly skillful job, which is why 90% of the people who come here lose their capital. People are more focused towards just making money and keep learning aside.
Things don’t work this way in the stock market. With three years running post-covid-era, we have seen multiple people opting out of the market, whoever came in during this period. The straightforward reason for this is they should have focused on learning. The more you learn here, the more you earn here, as simple as that.
In order to boost your awareness of the candlesticks pattern, which are essential for technical analysis during day trading, or technical analysis for investments, one must follow some discipline.
We are bringing you a detailed post on the different types of candlesticks pattern which traders master in stock market. Each of these patterns have been explained with a YouTube video of 30 seconds to 1 minute to enhance your learning.
Let’s dive into the ocean of knowledge of the most common candlesticks to trade in the live market in 2023.
To Open Free Demat Account Click Here
What are candlesticks patterns? How to trade in stock market using candlestick patterns?
Candlesticks convey a particular asset’s price-action or price movement in the stock market. Charts usually show the price on the rightmost side and the duration/timing on the bottom. A bar consisting of wick(lines) which immerse out of top and bottom are basically known as the candle.
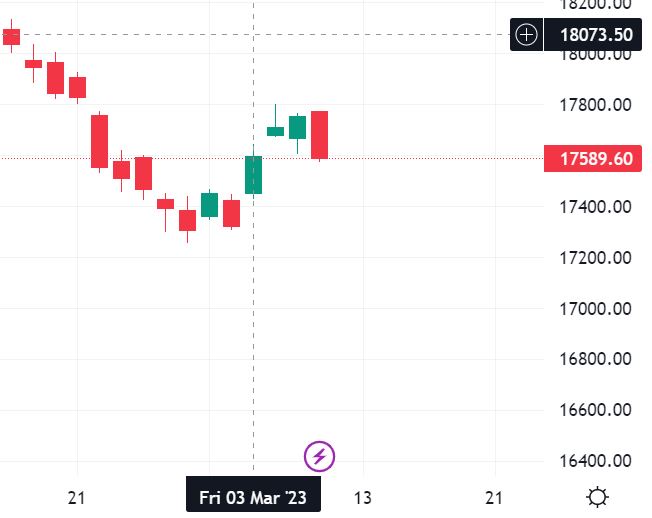
Below is a pictorial representation of candlesticks across a period of time for the Nifty-50 Index;
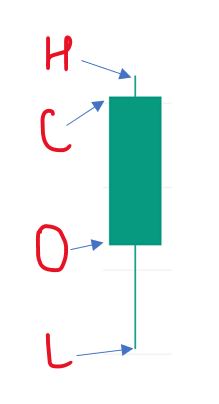
These candles consist of 4 parts;
- Open Price
- High Price
- Low Price
- Close Price
Often referred to as OHLC parameters of a candle in charts, these can be understood quite easily from their names of what they indicate. The image above also would help you to understand which point of the candle suggests what values.
Furthermore, these candles are then classified into 2 categories, bullish candles and bearish candles. Each of these has its own representation. Bullish candles are represented using green colour, while bearish candles are red.
The core concept behind this colour significance is the closing price. If the closing price of the current candle is greater than the previous candle in any time frame, this would be a bullish candle. Whereas, if the current candle’s closing price is lower than that of the last candle, then it is considered a bearish candle.
Doji Candle:
This candle has zero or nearly no range between its opening and closing. Instead of implying potential reversal or the apparent dominance of bulls or bears, these candles indicate indecision or balance between the two players.
Neither sellers nor buyers are in complete control. A doji which occurs in the context of a strong trend, indicates the weakening of the dominant force, which resulted in the movement. A “long-legged doji” has long wicks in both directions, which implies balanced pressure from both buyers and sellers.
The “dragonfly” and “gravestone” dojis indicate that the sellers and buyers, respectively, dominated the market for most of the trading session. However, the opposite group managed to get the price back to the opening level before the end of the trading session.
While traditional and long-legged dojis suggest indecision and hesitation, gravestone and dragonfly dojis provide more precise and more robust signals that a market force has emerged to push the market in the same direction as the wick and away from the candle’s body.
In this regard, gravestone and dragonfly dojis are similar to the hammer and hanging man patterns. Let us look at the below short video to understand the core concepts behind a Doji candle.
Hammer Candle:
A candlestick known as a “hammer” features a small body, a long wick extending below the body, and little to no wick above it. This is quite similar to a dragonfly doji, but the difference is that a dragonfly doji has virtually no body, which means that the open and close prices are at the same level.
If a hammer candlestick appears at the bottom of a downtrend, its long wick suggests that the bears have been unsuccessful in pushing the price down while the bulls are attempting to quickly push the price back up before the trading period closes.
Therefore, a hammer candlestick in the context of a downtrend indicates the potential for the downtrend to be exhausted and for a bullish reversal to occur. The “neckline,” which is often determined by the high of the previous candle, is the level that the price must reach on the next candlestick to confirm the hammer’s reversal signal.
Hanging Man Candle:
A candlestick known as a “hanging man” has the same shape as a hammer candlestick, but it appears in uptrends instead of downtrends. The difference is that the hanging man pattern features a wick extending downward, which goes against the direction of the uptrend and indicates the bearish demand, which is capable of pushing the price down.
This often serves as the first indication that the uptrend is losing momentum and that bears are starting to create a reversal. To confirm the reversal signal, the subsequent bearish bar needs to reach the “neckline” established by the opening of the bullish candle on the other side of the hanging man.
Shooting Star:
The shooting star candlestick is the opposite of the hanging man pattern, where it has a small body and a long wick above it with little to no wick below. It appears during the peak of an uptrend, with its long wick indicating that there is resistance to further bullish movement above the close, and a bearish reversal may be approaching.
To confirm or enter a position, a strong black candle or a price level equivalent to the previous bar’s open may serve as a signal. Shooting stars are often characterized by a gap between the last bar’s close and the shooting star’s relatively higher open.
To Open Free Demat Account Click Here
Checkmates:
Checkmates refer to a situation where the price is stuck within a narrow trading range before reversing its direction. In a typical bearish checkmate, an uptrend encounters a resistance level that is tested but rejected due to the pressure from sellers.
The checkmate begins when the first candle in the range reaches a high that the bulls cannot surpass, and the price remains deadlocked in a tight trading range until a long bearish candlestick breaks the range, indicating the start of a reversal. As an entry signal, this pattern needs confirmation from one or two strong bearish candles.

In a bullish checkmate, the opposite happens, typically at a support level. The 1st pin bar in the red box establishes a low that the bears cannot achieve, trapping the price in a narrow trading range, the checkmate until the bulls successfully reverse the trend. The tall white bar immediately after the box confirms the bullish reversal.
From the presented patterns, a simple concept emerges: a long wick appearing in the context of a trend often signals a potential reversal of that trend.
Evening Star:
The “evening star” pattern consists of 3 candles, with the middle candle being a small-bodied one that can act as an early indicator of a reversal from a bullish trend to a bearish trend. The opening price of the middle candle is typically at or above the close of the previous candle, and a gap above it indicates the gap between the body of the previous candle and the opening of the consequent candle. This pattern represents a potential top, which can be seen as a signal to sell. The three candles have the following characteristics:
- A long bullish candle.
- A minute-bodied bullish or bearish candle, or a doji candle, that opens at or above the close of the previous candle.
- A black candle that opens below or at the low point of the previous candle’s body and closes below or at the centre of the first candle. For the pattern to stand valid, the sequence of candles must be as described above, and it should appear in the context of an uptrend to signal a reversal and the start of a downtrend.
Morning Star:
The three-bar pattern known as the “morning star” is essentially the opposite of the “evening star,” with a small-bodied candle referred to as the “star” serving as the centrepiece. This small candle typically opens at or below the close of the previous candle or creates a gap below it, indicating that a bearish trend is transitioning to a bullish one. The morning star pattern is an indication of a potential bottom in the preceding bearish movement and functions as a buy signal. The three candles that make up this pattern are:
- A long bearish candle.
- A minute-bodied bullish or bearish candle or a Doji candle that opens at or below the close of the previous candle.
- A white bullish candle which opens at or above the high price point of the previous candle and closes above or at the centre of the first candle. While an evening star pattern in an uptrend signals a reversal, a morning star pattern in a downtrend can also signal a reversal and a shift of balance in power between bears and bulls.
Bullish Engulfing:
The bullish engulfing pattern is characterized by a bullish candle that completely engulfs the real body of a preceding bearish candle. This signifies an increase in trading activity from both the bearish and bullish sides and a shift in overall market sentiment towards bullishness.
It is crucial to view this pattern in the context of the prevailing trend at the time. For instance, if a bullish engulfing pattern appears during a downtrend, it may indicate a potential shift in price trend, with buying demand becoming the dominant force that could eventually push the price higher within the relevant timeframe.
Bearing Engulfing:
The opposite of a bullish engulfing pattern is the pattern in question, where the body of a bullish candle is enclosed by a subsequent bearish candle’s body. This signals an increase in trading activity from both bears and bulls, leading to a shift in overall market sentiment towards a bearish outlook.
Similar to other patterns, it is essential to consider the trend’s context. The appearance of a bearish engulfing pattern during an uptrend is most indicative of a bearish price move.
Inside Bar/Harami:
The harami/inside bar pattern consists of two candlesticks, with the first one completely enclosing the second. Traders interpret this pattern in two ways: firstly, as a sign that increased volatility is on the horizon, allowing for trades based on volatility rather than direction.
Secondly, when viewed within the context of a trend, the harami/inside bar pattern can signal exhaustion and an impending reversal. This is similar to the long wick patterns and evening star/morning star patterns previously discussed.
To Open Free Demat Account Click Here
Kicker:
When a trend is in motion, and a gap suddenly appears in the opposite direction of the trend, it is referred to as a kicker signal or professional gap. A gap is identified as a break in the price movement between the open and close prices of consecutive candles.
For instance, if the price has been steadily increasing from 2 to 10 over a few days and then suddenly drops to 8, this is a gap in the opposite direction of the trend, known as a bearish kicker. Similarly, if the price drops from 10 to 3 and then rises to 5 the following day, this signals a bullish kicker, indicating a bullish sign for traders.
Such signals are useful for predicting an increase in volatility, indicating a potential reversal or shift in trend.
A kicker signal is a potent indicator of a trend reversal, as it is believed to reflect the swift realization of professional investors that a trend has ended, and they are eager to exit their positions. This signal can trigger a fast and decisive reversal of the previous trend.
Piercing Line:
This is a bullish signal that appears during a downtrend. After a long bearish candle, a new bullish candle opens at a lower level and then closes at a point at least halfway up the previous bar’s body. This two-bar indicator is a reliable signal for a trend reversal, and the strength of the signal is related to the second bullish candle’s height.
This pattern is quite similar to the Tweezer pattern.
Dark Cloud Cover:
The bearish version of the Piercing Line pattern is the two-candlestick bearish reversal pattern observed at the end of a bullish trend. The first candle is bullish and is succeeded by a bearish candle which opens at a higher level and then closes at least halfway down the body of the preceding candle.
The potency of the reversal signal is linked to the magnitude of the second candlestick. This pattern shares a comparable concept and mathematical calculation with both the Piercing Line and Tweezer patterns.
3 White Solider:
The three soldiers pattern is a bullish pattern consisting of three candles that indicate a potential reversal at the end of a bearish trend. The three candles are all bullish and open within the previous candle’s body, closing near the high of the day.
It is crucial that all three candles be strong bullish candles with very small wicks and a close near to the top. The high closes suggest a strong shift in market sentiment from bearish to bullish.
3 Black Crows:
The opposite of the “3 White Soldiers” pattern is a 3-candle pattern that indicates a shift in market sentiment from bullish to bearish at the top of an uptrend.
This pattern comprises three consecutive bearish bars that open within the body of the previous bar and close below its close.
Tweezer Pattern:
These two-candlestick patterns serve as reversal signals at either the tops or bottoms of trends where 2 consecutive candlesticks share either a high or low but move in opposite market directions.
In the case of a tweezer top, a bullish candlestick appears in an uptrend and closes near its high, which then becomes the high of the second candlestick. The second candlestick moves bearishly downwards throughout the day.
On the other hand, a tweezer bottom features an initial bearish candlestick that continues a downtrend, closing at or near a new low. This low then becomes the low price of a subsequent bullish candlestick.
Tweezers suggest that at a significant level (the top or bottom shared by the two candles), bears and bulls have traded dominance. As with the Piercing Line and Dark Cloud Cover patterns, this signal may indicate a potential trend reversal.
This post is strictly for Educational Purpose, we expect our viewers/readers to trade at their own discretion.
For more such content follow PrTechNews
To Open Free Demat Account Click Here